Summary
What it is
This heading covers ships' propellers and their blades, and also machine parts with no electrical connectors, insulators, coils or other electrical features that are not named elsewhere in the chapter. These are industrial pieces, mostly metal, made to order or in series. They travel in crates or on pallets, and large propellers as heavy cargo.
- World trade
- $11.6billion
There is no reliable price for 2024; the latest year with a price is 2023.
Market overview
Supply is moderately concentrated: the top three exporters add up to 47% of the total, and it takes 4 countries to make up half. Purchases are more spread out than sales: the three largest importers add up to 25%. Germany leads sales today and already did in 2014, with a nearly unchanged share: 19.5% then and 18.5% now.
Over ten years world trade rose 13%, from $10.2 billion in 2014. The movement held over the last five years: it rose 16% against 2019. 2024 is the highest value in the whole series.
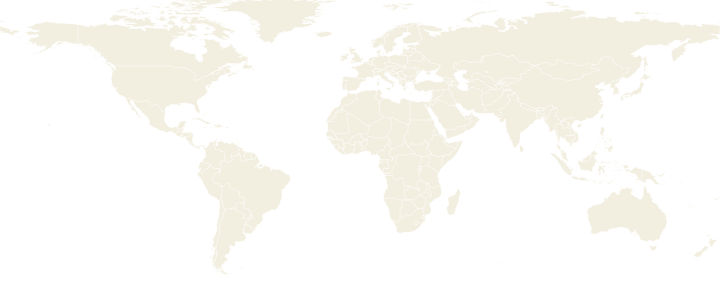
Regional and long-distance trade are mixed: 9 of the 15 largest flows stay within a region and hold 51% of the value of those flows. China leads purchases with 8.7% of the total, just ahead of Germany: the gap between the top two is narrow. It also ranks 2nd among exporters, so it buys and sells at the same time.
Top exporters
World supply
Germany went from 22.4% to 18.5% of world exports of ships' propellers and non-electrical machinery parts
In 2024, Germany accounted for 18.5% of recorded world exports and the three largest exporters together for 47%. HHI: 895 out of 10,000; equivalent to 11 exporters of the same size.
Share of recorded exports, not of production: a country that produces a lot and consumes almost all of it may export little
Trend in supply
Share of world exports of the largest exporter and of the three largest
Share (%)
- Largest exporter each year 18.5%
- Three largest 47%
Source: CEPII BACI
Show the numbers
| Year | 1995 | 2024 |
|---|---|---|
| Largest exporter each year | 22.4% | 18.5% |
| Three largest | 50% | 47% |
Countries where Germany sells more than half of what they buy
Countries that buy more than half of this product from its largest exporter, with its share.
- Finland: 69% of its purchases · Dependence of Finland on Germany
- Sweden: 54.8% of its purchases · Dependence of Sweden on Germany
- Hungary: 56.1% of its purchases · Dependence of Hungary on Germany
- North Macedonia: 54.6% of its purchases
- Georgia: 51.5% of its purchases
Top importers
Trend
Who sells it
Germany was the top exporter throughout the period
Value in USD billions. The five largest exporters in 2024.
- Germany 2.1
- China 1.9
- United States 1.4
- Japan 0.74
- Italy 0.45
Source: CEPII BACI
Show the numbers
| Country | 1995 | 2024 |
|---|---|---|
| Germany | 0.77 | 2.1 |
| China | 0.02 | 1.9 |
| United States | 0.58 | 1.4 |
| Japan | 0.37 | 0.74 |
| Italy | 0.2 | 0.45 |
Price
Implied price
Implied price per tonne
Current US dollars per tonne: value over the weight reported by BACI.
- 2023: $22,536
Source: CEPII BACI
Show the numbers
| Year | USD per tonne |
|---|---|
| 1995 | $16,373 |
| 1996 | — |
| 1997 | $14,519 |
| 1998 | $16,668 |
| 1999 | $15,764 |
| 2000 | $17,296 |
| 2001 | $15,384 |
| 2002 | $15,261 |
| 2003 | — |
| 2004 | $16,707 |
| 2005 | $19,212 |
| 2006 | $17,747 |
| 2007 | $17,144 |
| 2008 | — |
| 2009 | $20,592 |
| 2010 | $18,682 |
| 2011 | $21,624 |
| 2012 | $20,580 |
| 2013 | $19,515 |
| 2014 | $20,183 |
| 2015 | $17,788 |
| 2016 | $21,404 |
| 2017 | — |
| 2018 | $21,875 |
| 2019 | $22,340 |
| 2020 | — |
| 2021 | $21,632 |
| 2022 | $21,397 |
| 2023 | $22,536 |
| 2024 | — |
There is no reliable price for 2024; the latest year with a price is 2023.
What it includes
- 8485 · Ships' propellers and non-electrical machinery parts
Sources and methodology
Sources and licenses
- CEPII BACI · Licence Ouverte Etalab 2.0
- Natural Earth · Public domain
Methodology
Goods trade from CEPII BACI (BACI_HS92_V202601), which reconciles what exporters and importers report: countries that stopped reporting (Russia since 2022) appear with their partners’ data. FOB values in current US dollars; tonnes when BACI reports them. The price per tonne is the value of the rows with a weight divided by that weight. The transport mode is our own estimate based on value per kilo and geography. Data up to 2024.
Hong Kong, Singapore, the Netherlands and Belgium re-export goods from other countries: their figures include transit.